Originality
While combining medical imagery, a computer vision model, and a health outcome is not novel in of itself, many similar projects commonly stop at this point. Expanding the MRI Analyzer pipeline from the primary medical image, an MRI, to include both Ultrasound images and patient metadata increases its potential performance, but still only provides information on the point estimate of the outcome of interest, i.e. cancer. To expand the value of MRI Analyzer in providing new, useful information, uncertainty estimation was also included for each stage in the pipeline. This quantifies not just how the process would classify an individual in regards to cancer presence, but also how much variability is associated with an individual’s prediction.
Introduction to uncertainty
Uncertainty is everywhere, both in real life and in the world of statistics, but it is often only quantified for specific occasions. Mathematically uncertainty is analogous to a standard error in statistics, but differs in that it considers both statistical and non statistical sources of error when an estimate is generated.[1] What this means is that in addition to traditional statistical measures of variation, it also includes outside or informal knowledge of how an estimated value could be wrong. This could be a measurement of input data that was incorrect, or an equation that doesn’t reflect the true relationship between its inputs and outputs in the real world. For this reason, it is common to see uncertainty represented as 𝞼 similarly to a standard error, or with a point estimate X be shown as:
X ± 𝞼
X (𝞼)
The advantage of an uncertainty estimate is that often it could be these informal factors that lead to incorrect conclusions. This is especially true in practical settings where data is messy, or in machine learning where models are empirically chosen and fit. Therefore, an evaluation of an uncertainty estimate is often based on what factors it chose to include, and what it chose to ignore or assume was irrelevant.
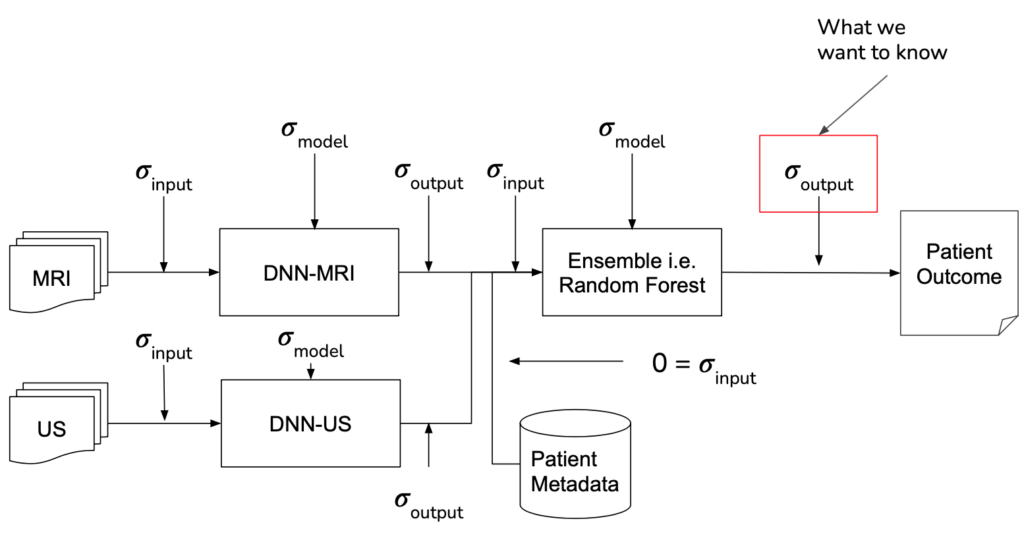
MRI Analyzer not only provides an uncertainty estimate on the final outcome, a patient’s cancer status, but does so by considering uncertainty at all steps in the pipeline. Only patient metadata, such as the recorded age, height, etc. was assumed to have a negligible amount of uncertainty associated with it. This makes MRI Analyzer both informative and thorough in understanding how a health critical scenario may be processed by black-box like models. The image shown below highlights these stages.
implementation
Formally, when there is some output of a process, the uncertainty associated with it is a function of both the uncertainty in the input and the uncertainty in the process itself. In traditional disciplines of science, the relationship between output uncertainty and these values is usually derived analytically.
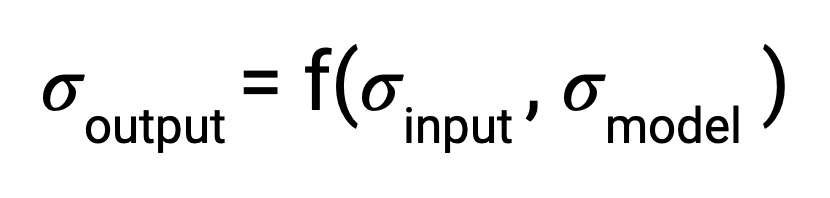
With machine learning, however, the number and complexity of operations makes this impractical. To address this gap, several literature techniques were incorporated in order to estimate uncertainty and propagate it through each stage in the pipeline.
The central theme of all the literature techniques used in MRI Analyzer is the Monte Carlo method.[2] This involves a procedure where one component, whose effect on output uncertainty is being estimated, is randomly varied and a prediction is made. After repeating for many iterations, the resulting predictions will form a distribution from which the contribution to output uncertainty from the varied component can be estimated.
Shown in the pipeline graphic earlier, however, there are many scenarios the Monte Carlo method must be adapted to. Specifically, procedures were implemented to use this method by:
Input Uncertainty Propagation | DNN Model Uncertainty[3] | Random Forest Model Uncertainty | |
1 | Add random variation to input following assumed/estimated distribution | Add dropout between layers during evaluation, randomly throwing away information in the network | Take one decision tree classifier from the ensemble |
2 | Make prediction | ||
3 | Repeat 1-2 a large number of times | ||
4 | Calculate uncertainty from distribution of outputs | ||
results
Monte Carlo Fitting
While literature methods allowed for uncertainty estimation to be incorporated into all parts of the pipeline, certain parameters still needed to be adapted to the MRI Analyzer use case. These included:
- Number of forward passes for each simulation
- Dropout probability in DNN Model Uncertainty
- Number and location of dropout layers in DNN Model Uncertainty
- 100 forward passes for input uncertainty propagation
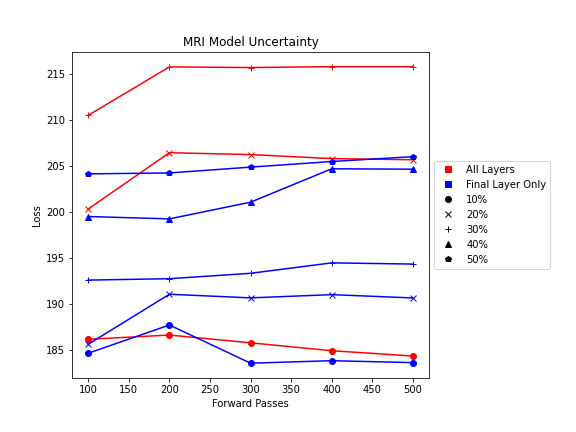
- MRI Dropout with 10% probability behind the classification layer only, at least 300 forward passes
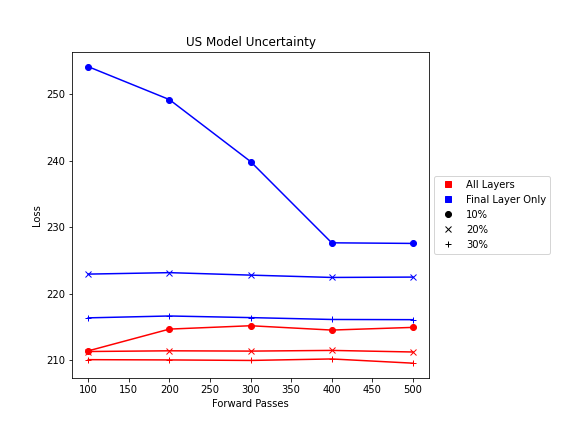
- Ultrasound Dropout with 30% probability behind all layers, at least 100 forward passes
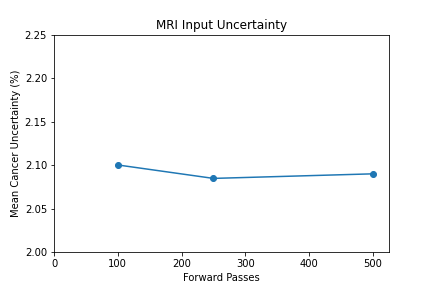
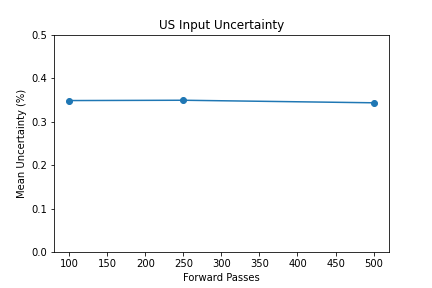
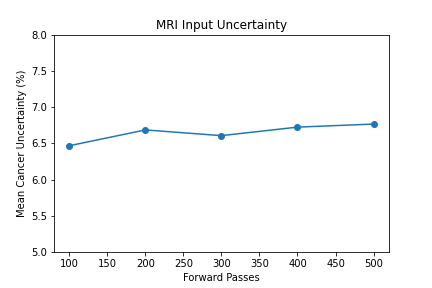
The number of forward passes for input uncertainty propagation was chosen to be 100 since further increases did not appear to change the average value of uncertainty in the predicted outcomes. This was found to be true for all locations where input uncertainty is propagated in the pipeline.
Choosing the implementation parameters of the DNN Dropout method was more complex, and involved a modified grid search as described by the method’s authors.[4] The general need for dropout tuning comes from the fact that if dropout is over utilized, too much information is thrown out in the network for any meaningful uncertainty estimate. Keeping the use of dropout too limited, however, will result in almost identical predictions since very little about the network is changed. Therefore, the best use of dropout is found by a unique loss function that captures when estimates are large enough to capture uncertainty for incorrect predictions but not too large such that correct predictions become overly uncertain. Each prediction still retains its own unique uncertainty estimate, but the cumulative differences for a certain set of dropout parameters can be found and compared to the results of other dropout parameters. For each of the DNN models, a minimum number of forward passes was also found, less than which the estimates were too inaccurate to be chosen by the loss function.
Uncertainty Estimates on Test Data
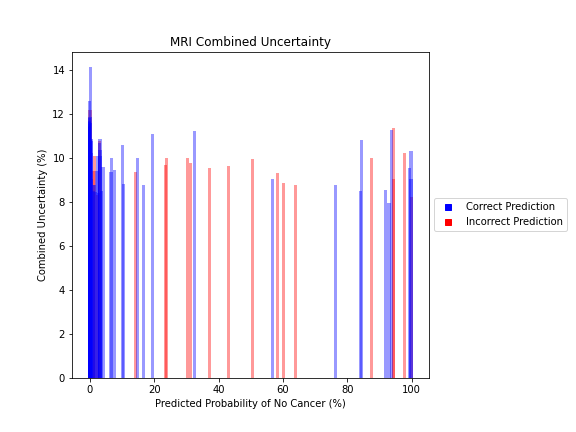
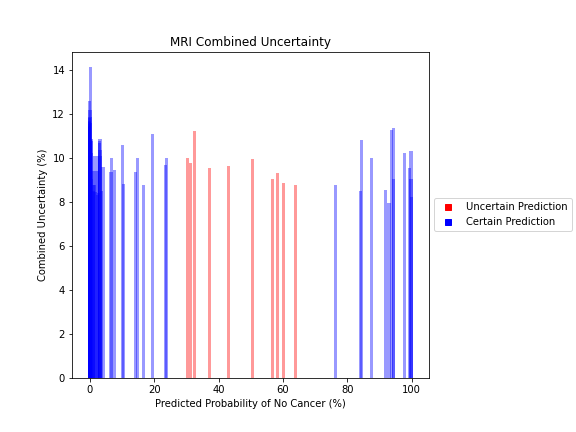
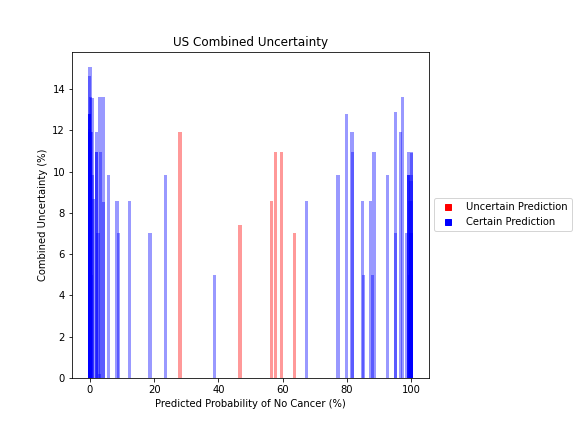
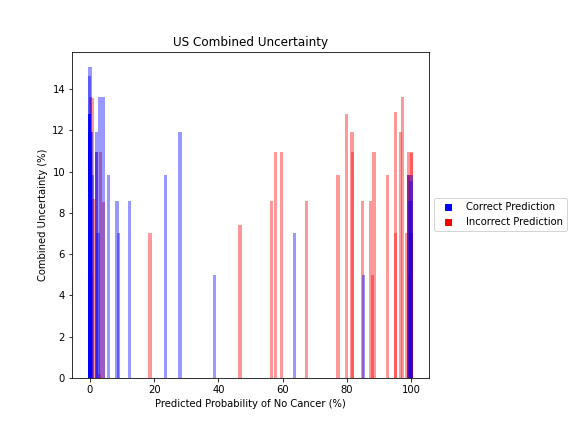
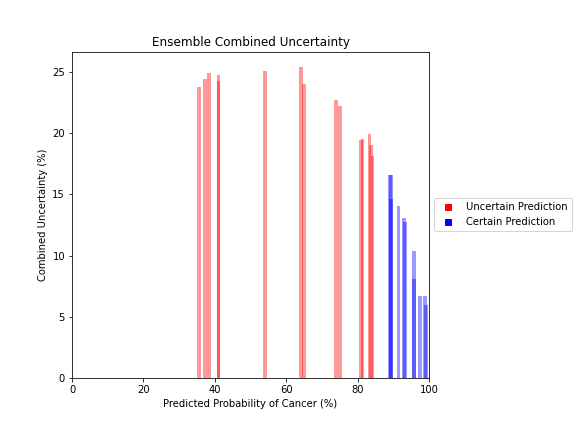
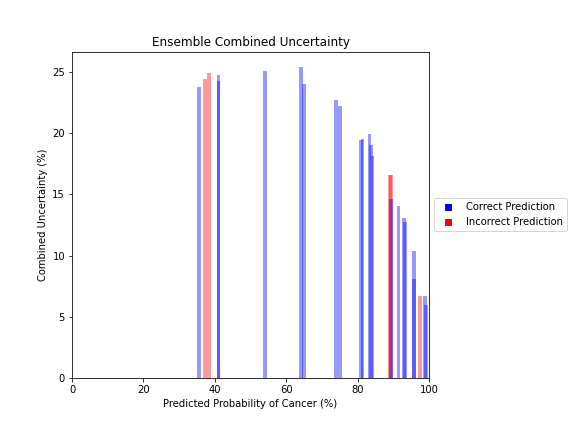
General trends of the uncertainty estimates can be observed from the graphs on the right:
- MRI-DNN combined uncertainty is mostly uniform, between 8-14%
- US-DNN combined uncertainty is more variable, between 6-15%
- Random Forest combined uncertainty is much larger towards ambiguous cancer probabilities closer to 50%
- Higher uncertainty at ends of DNN range, along with presence of incorrect predictions, demonstrates extreme point estimates not indicative of correct classification
- Binary classification, as demonstrated by the Random Forest results, is where uncertainty adds least value compared to intuition
For the purpose of the pipeline, an “uncertain estimate” was defined as one which was within ± 2𝞼 from the decision boundary of 50% predicted probability of cancer.
References
[1] Farrance, I., & Frenkel, R. (2012). Uncertainty of Measurement: A Review of the Rules for Calculating Uncertainty Components through Functional Relationships. The Clinical biochemist. Reviews, 33(2), 49–75.
[2] Papadopoulos, Christos & Yeung, Hoi. (2001). Uncertainty estimation and Monte Carlo simulation method. Flow Measurement and Instrumentation. 12. 291-298. 10.1016/S0955-5986(01)00015-2.
[3] Gal, Yarin & Ghahramani, Zoubin. (2015). Dropout as a Bayesian Approximation: Representing Model Uncertainty in Deep Learning. Proceedings of The 33rd International Conference on Machine Learning.
[4] Yarin Gal, Jiri Hron, and Alex Kendall. 2017. Concrete dropout. In Proceedings of the 31st International Conference on Neural Information Processing Systems (NIPS’17). Curran Associates Inc., Red Hook, NY, USA, 3584–3593.