Correct use of statistics, and more generally the scientific method, is crucial when justifying critical decisions such as the go/no-go of a Space Shuttle launch. To demonstrate this, this exercise analyzes pre-launch data available only before the final Challenger disaster. A similar dataset was used by contractor Morton Thiokol and NASA, but mistakes in analysis led no expectation of increased danger with the Challenger‘s final launch.
As with any dataset, understanding what information is available is a prerequisite to deciding what value to extract from it. Although the size of this dataset is small, with only 23 observations from previous Shuttle launches, the choice of how to treat it is equally as important and influential to later analysis.
Flight | Temp | Pressure | O.ring | Number |
1 | 66 | 50 | 0 | 6 |
2 | 70 | 50 | 1 | 6 |
3 | 69 | 50 | 0 | 6 |
4 | 68 | 50 | 0 | 6 |
5 | 67 | 50 | 0 | 6 |
6 | 72 | 50 | 0 | 6 |
An excerpt of the first six entries in the dataset is shown above. For each of the 23 previous Shuttle launches, there are five variables and no missing values. In total there is a small amount of information available, which is to be expected with rare events such as Space Shuttle launches. However, it provides an opportunity to more thoroughly examine all aspects of the dataset.
To begin, the meaning of each variable must be properly understood. Flight represents a generic index for each launch, i.e. a unique number 1-23 for each entry in the dataset. O.ring represents the number of primary field-joint O-rings which experienced a “thermal distress” event. This was defined as when either the effects of erosion or blow-by could be observed in the recovered SRBs post launch. For the purpose of this report, these distress events will be interchangeably referred to as O-ring failures. This may generally make the analysis find a higher probability of catastrophic failure than could really have been predicted, since a full O-ring failure would only be found from erosion followed by blow-by and not erosion alone. However, since these are not differentiated in the dataset, it will be assumed all distress events include blow-by and constitute a full O-ring failure.
Although every launch had 12 field-joint O-rings in total, only six of these are primary while the second six are secondary. As confirmation of the total, the variable Number represents the count of primary field-joint O-rings and is constant at six for all launches. Temp and Pressure represent the recorded ambient launch temperature in Fahrenheit and field-joint pressure in psi respectively. Temp is recorded to the nearest degree, while Pressure is recorded to the nearest 50 psi (e.g. 50, 100, 150, etc). With a much coarser grain of pressure measurements, it may not be as meaningful since less specific information is recorded.
Being the cause of the accident, the O.ring variable will be examined to start. In this analysis, unless stated otherwise “O-ring” will refer specifically to a primary field-joint O-ring.
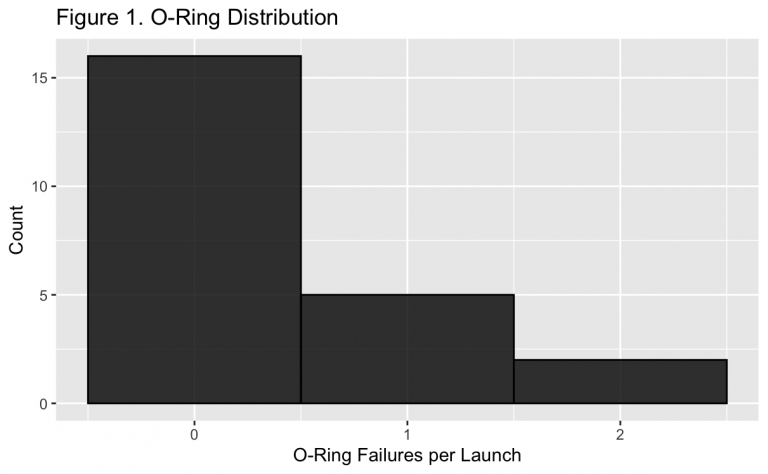
Shown above in Figure 1, the majority of launches experienced no O-ring failures. About 5 launches had a single O-ring fail, while even fewer had two. None of the recorded launches had greater than two O-rings fail. However, for a catastrophic failure to occur, all that was potentially needed would have been a single primary O-ring failure when its secondary backup had rotated and lost contact for a seal.
With the majority of launches having zero recorded O-ring failures, those that experienced any can be grouped together for a more discrete analysis. To better differentiate between these two situations, a new Boolean variable named distress is created which indicates whether a launch had at least one O-ring failure or not. With two potential predictors of these failures, Temp and Pressure, it will be important to understand how they relate to the distribution of the outcome.
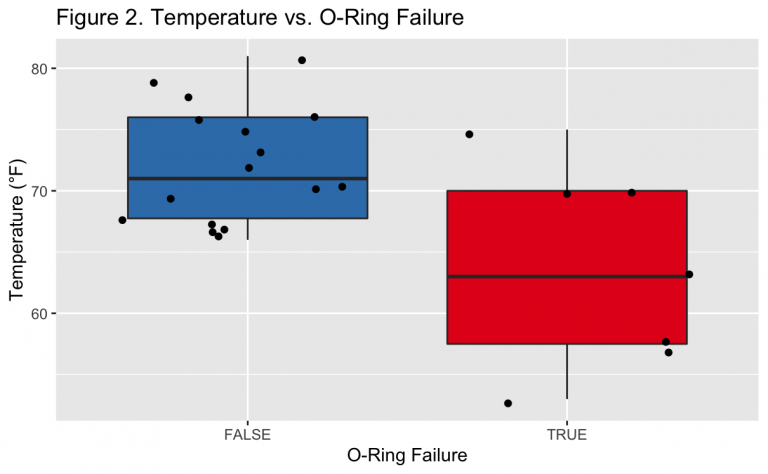
Demonstrated in Figure 2, the presence of at least one O-ring failure was generally observed at lower launch temperatures. In fact, with so few total observations, over half of the launches with at least one O-ring failure were colder than all launches with no failures. There is a single outlier that is notable, where at least one failure occurred at a launch temperature of ~75°F. This temperature would be greater than average even among the group where no failures were observed. Related to this point, there is greater variance in temperature for launches which had at least one failure compared to those which did not.
The other environmental variable in the data set, Pressure, may also be examined to see if insightful relationships emerge.
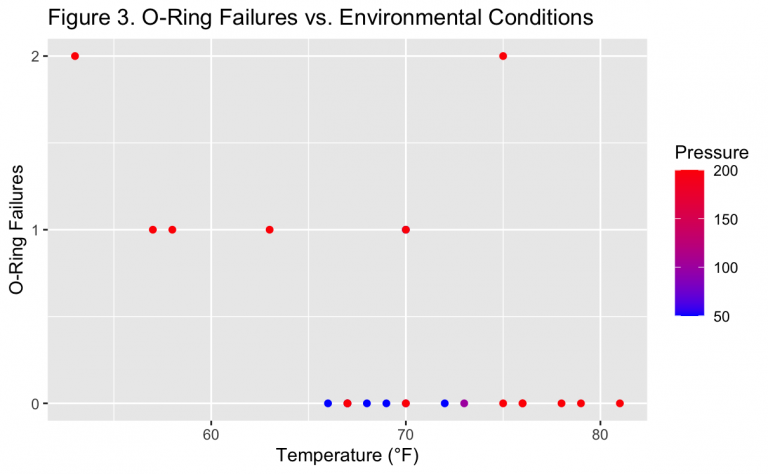
Figure 3 shows that generally the launches with a greater number of O-ring failures occurred at lower temperatures and higher pressures. This also fits with conceptual information known about the O-rings, such as lower temperatures causing them to shrink in size and provide a less complete seal against gases. Higher pressures could then also cause more erosion/blow-by from a greater amount of gas in the same space in the system. While all of the failures occurred at the highest pressure measurement of 200 psi, the general trend does not seem as strong as with temperature. For example, the 200 psi pressure measurement was also the most common value of this variable generally. However, temperatures around the midpoint of the range ~65-75°F also had lower pressures, which may have helped them avoid any failures.
The correlation between these variables can also be computed numerically for a more thorough understanding. Although pressure is binned into multiples of 50 psi, resembling an ordinal variable, the ratio of one pressure to another is still meaningful. For example, 200 psi is known to be four times as much pressure as 50 psi. A pressure of zero psi is also meaningful, meeting the definition of a ratio variable. Since theoretically a pressure can take on any value, even if only multiples of 50 are recorded, it will still be treated as continuous. The count of O-rings also meets the same definition of a ratio variable but is by nature discrete and not continuous. For example, 1.5 O-rings cannot fail for a given launch. Therefore, the Spearman’s rank correlation coefficient will be used.
Table 1. Correlation of Numerical Variables
| Temp | Pressure | O.ring |
Temp | 1 | 0.15 | -0.43 |
Pressure | 0.15 | 1 | 0.28 |
O.ring | -0.43 | 0.28 | 1 |
Table 1 shows the correlation between the three numerical variables which varied in the data set over the course of the launches, being Temp, Pressure, and O.ring. As suspected in Figure 3, pressure had a positive correlation with O-ring failures. This supports the previous observation that higher pressures were associated with both launches with and without failures, but lower pressures always were on launches without any failures.
Temperature had a stronger negative correlation with O-ring failure. This continues to follow the trend shown in Figures 2 and 3 where launches which experienced failures were generally at colder temperatures. Finally, it can also be seen that temperature and pressure have a much smaller and slightly positive correlation with each other. This is in agreement with physical science, where gas enclosed in fixed volume will grow to higher pressures if the temperature is increased. Since the function of the O-ring is to provide a seal, i.e. a fixed boundary, it would be reasonable that there is a slight positive correlation between the two.